Back
24 Feb 2020
USD/INR New York Price Forecast: Dollar challenges the 72.00 figure vs. rupee
- USD/INR is trading at fresh February highs.
- The level to beat for bulls is the 72.00 resistance.
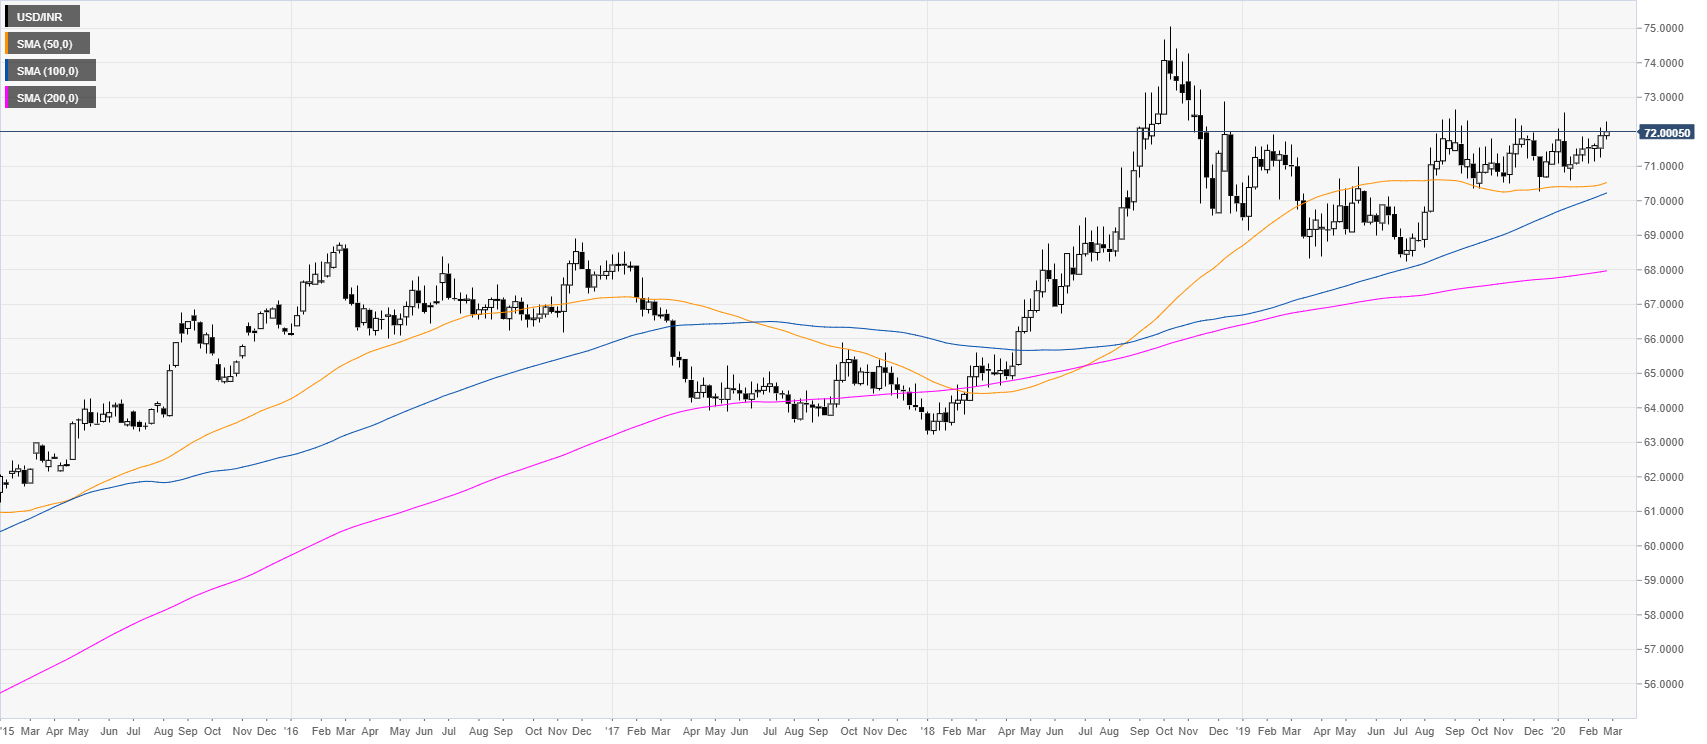
USD/INR weekly chart
Following the 2018 bull-run, the spot has been consolidating in a rectangle pattern. USD/INR is trading above the main weekly simple moving averages (SMAs), suggesting a bullish bias in the long term.
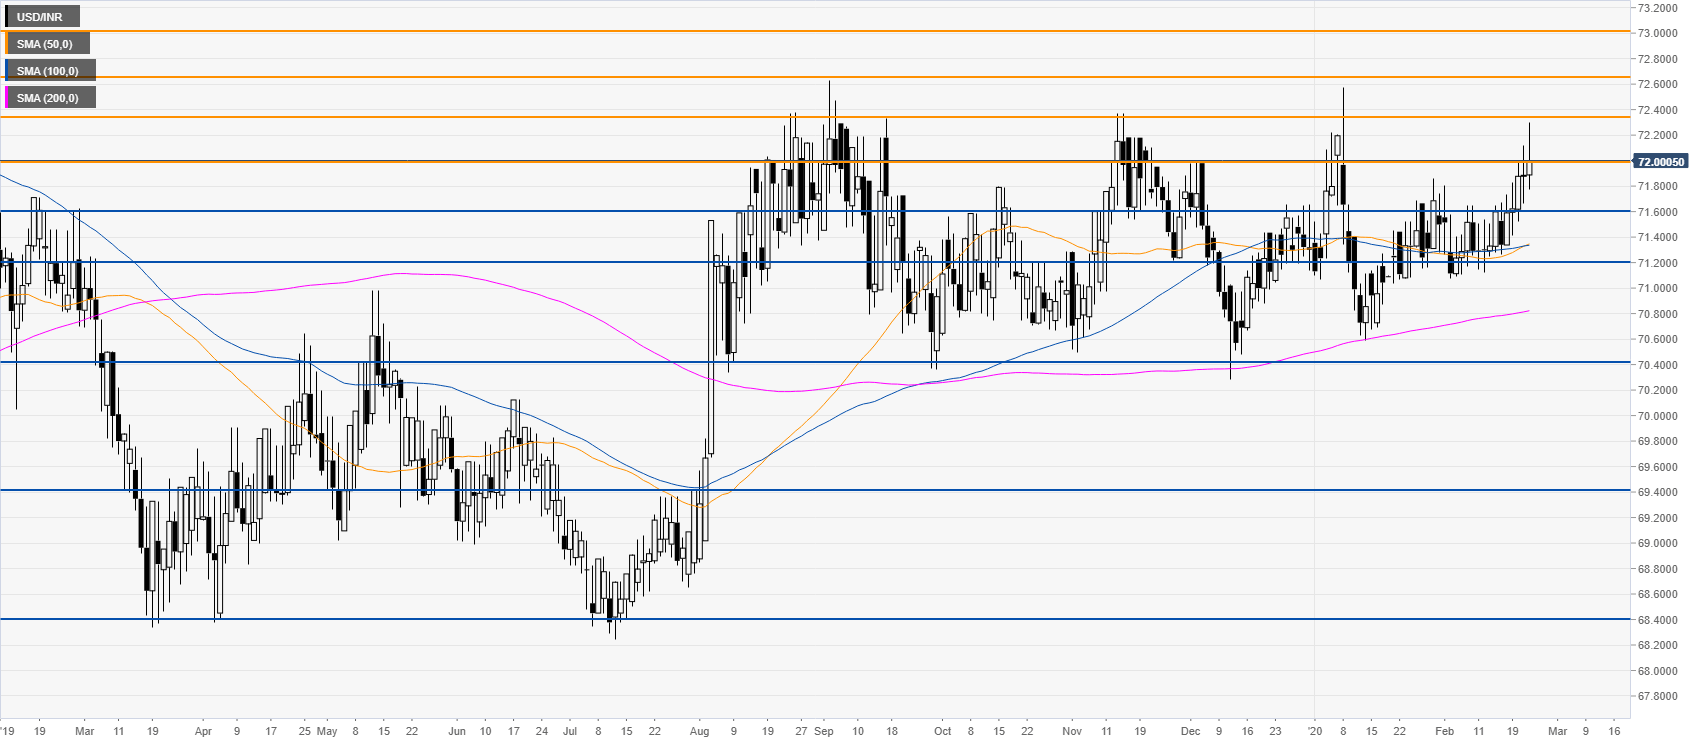
USD/INR daily chart
USD/INR is rising toward the 2020 highs while bulls put pressure on the 72.00 figure. A daily close above the above-mentioned level would likely open the gates to further gains towards the 72.35 and 72.66. Support is seen near 71.60 and 71.20 levels.
Additional key levels