Back
6 Feb 2020
US Dollar Index Asia Price Forecast: DXY rises to its highest since October 2019
- DXY is up for the fourth consecutive day, trading at four-month highs.
- Targets to the upside are seen near the 99.00 figure and 99.40 price level.
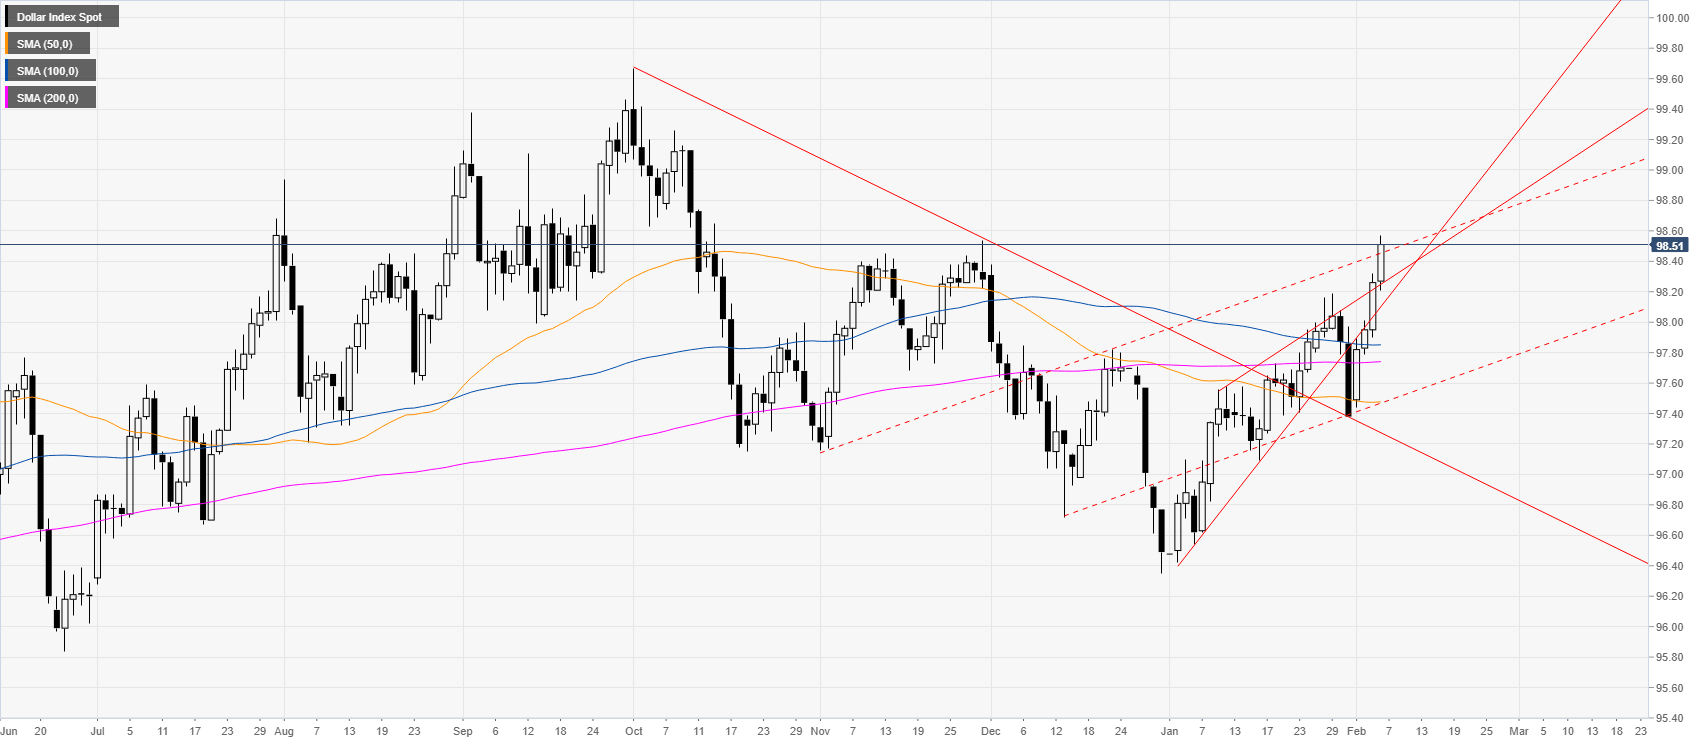
DXY daily chart
The US dollar index (DXY) is printing fresh 2020 highs while trading above the main simple moving averages (SMAs).
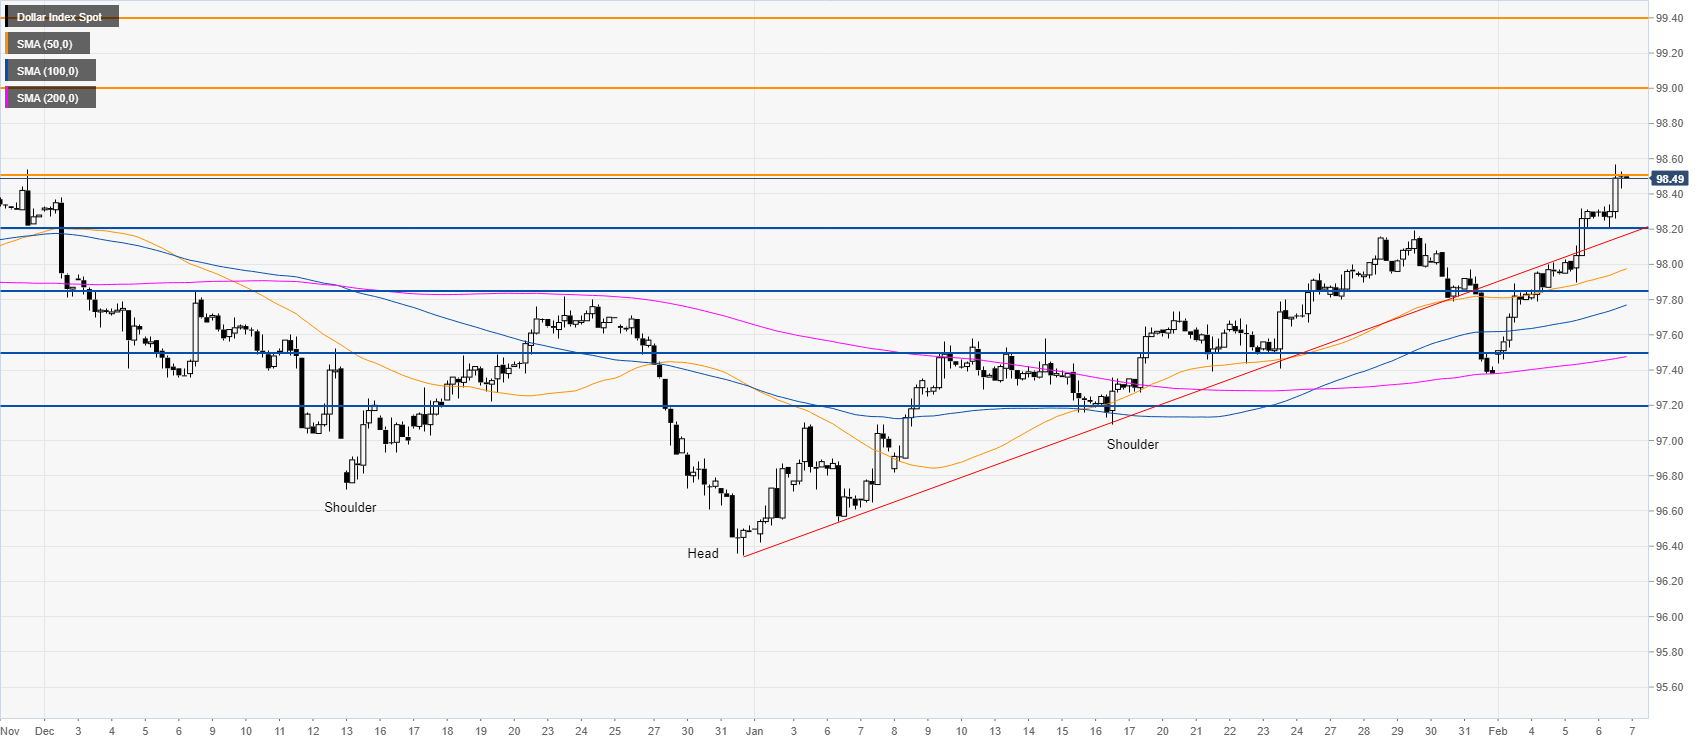
DXY four-hour chart
After the v-shaped recovery, DXY hit both the 98.20 and 98.50 targets on the way up. As the index is trending up, DXY is set to potentially keep moving north towards the 99.00 figure and the 99.40 level. Support is seen at the 98.20 and 97.85 price levels.
Additional key levels