Back
3 Feb 2020
USD/CAD Price Analysis: Greenback trading at its highest since early December vs. CAD
- USD/CAD is trading in a tight bullish channel.
- Bulls are eying the 1.3280, 1.3330 and 1.3367 levels.
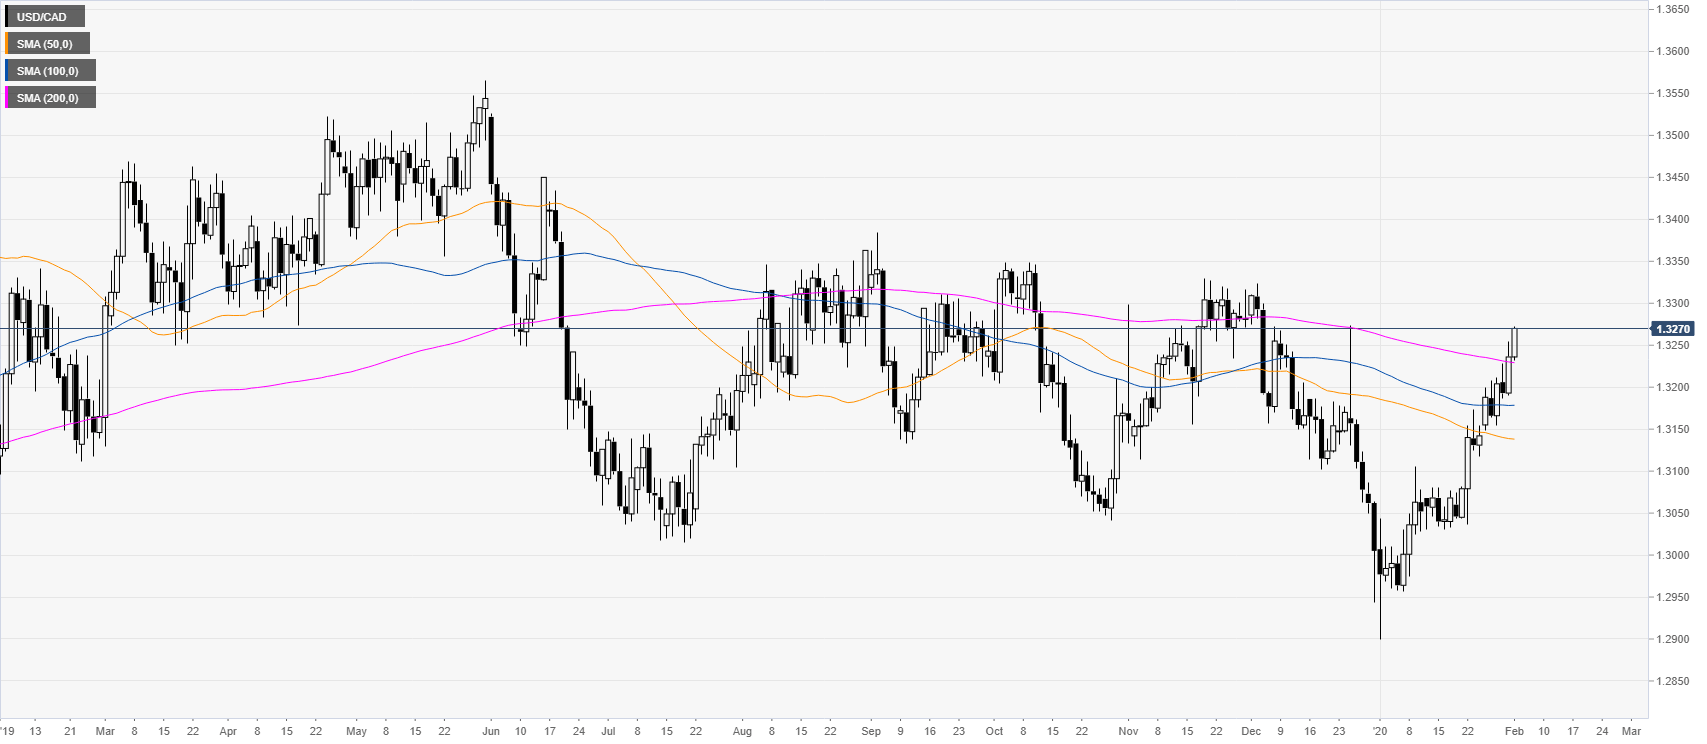
USD/CAD daily chart
USD/CAD is spiking to its highest since early December 2019 while trading back above the main daily simple moving averages (SMAs).
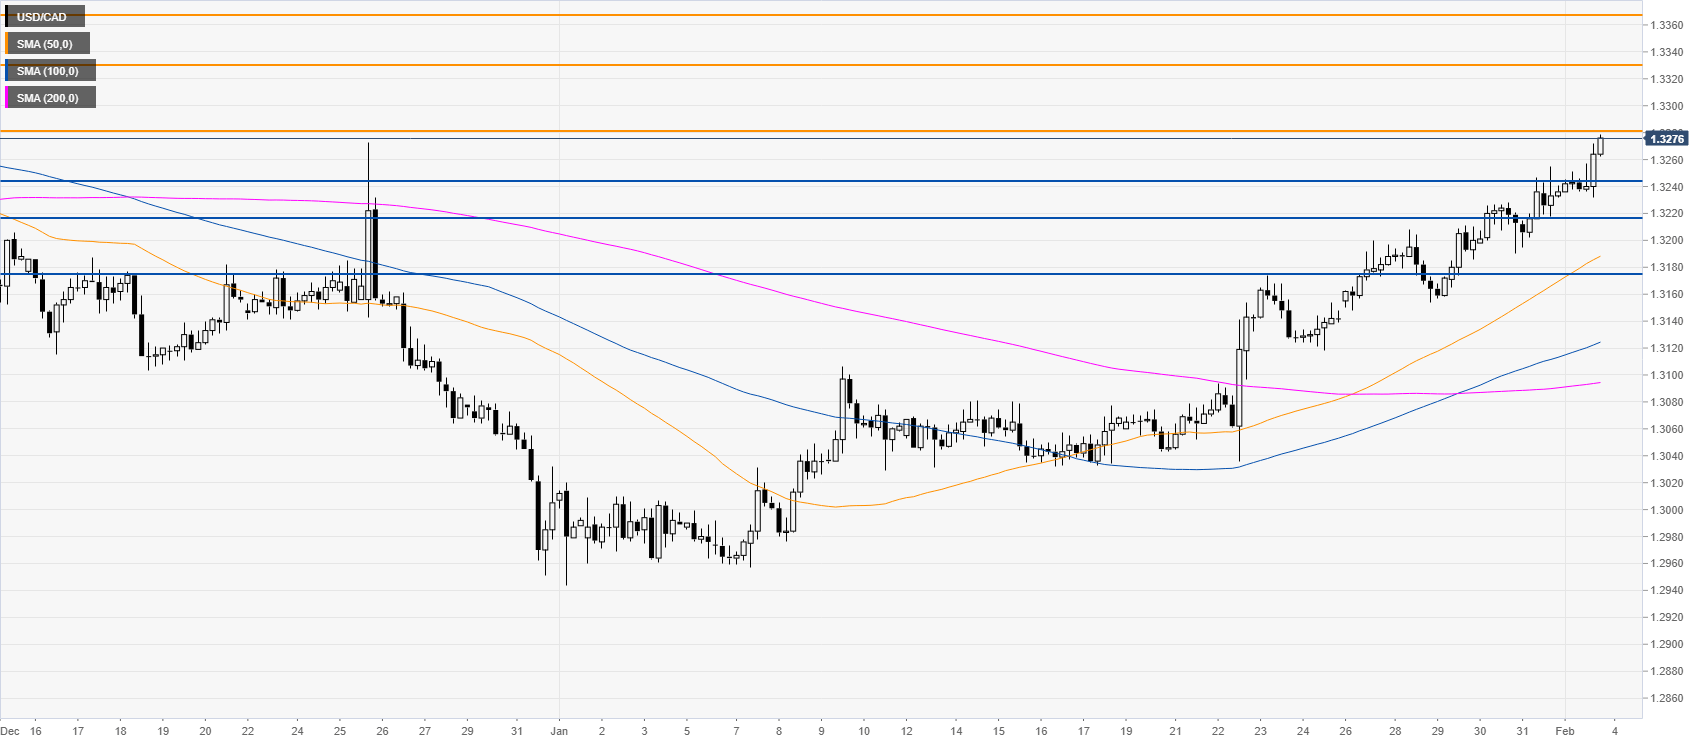
USD/CAD four-hour chart
USD/CAD is marching north in a tight bull channel above the main SMAs. As there are no signs that bulls should step out, the market is set to continue to appreciate on a break above the 1.3280 resistance towards the 1.3330 and 1.3367 levels, according to the Technical Confluences Indicator. Support can be seen near the 1.3243, 1.3216 and 1.3175 levels.
Resistance: 1.3280, 1.3330, 1.3367
Support: 1.3243, 1.3216, 1.3175
Additional key levels