Gold Price Analysis: Stays below $1,560 following Tuesday’s bearish spinning top
- Gold extends losses after registering the bearish candlestick formation/MACD during the previous day.
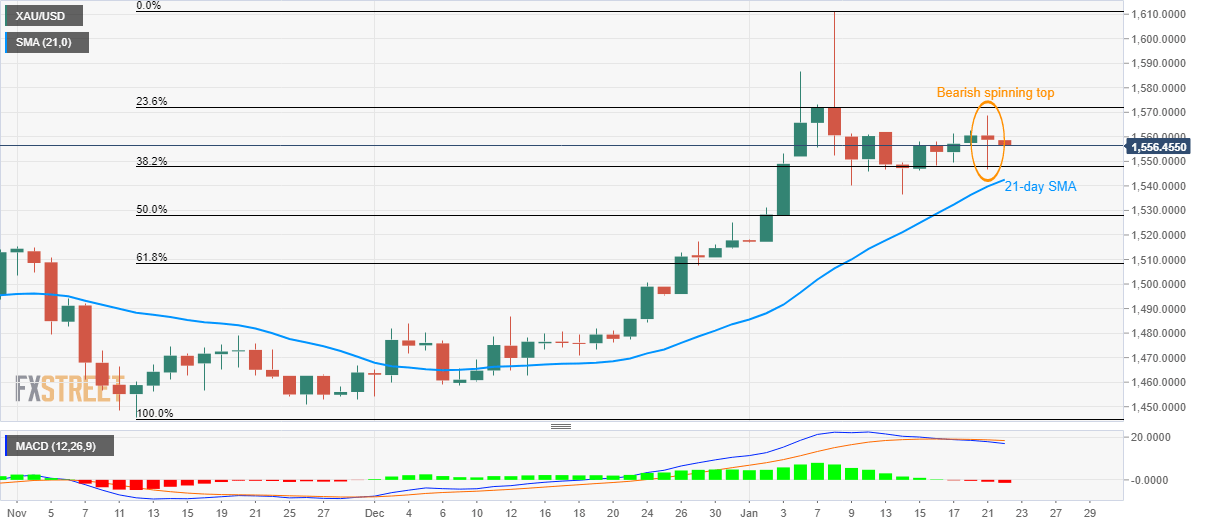
- 21-day SMA can act as immediate support, 23.6% Fibonacci retracement could question short-term buyers.
Gold remains on the back foot while trading around $1,556.90 during the Asian session on Wednesday. The yellow metal portrayed a bearish candlestick formation, backed by bearish MACD, during the previous day.
As a result, the bullion’s prices are likely to decline further towards 38.2% Fibonacci retracement of its November-January rise, at $1,547, ahead of testing 21-day SMA level of 1,542.55.
During the precious metal’s downside past-21-day SMA, 50% of Fibonacci retracement and November month high could please sellers around $1,528 and $1,515.
Alternatively, a daily closing beyond Tuesday’s high near $1,569 will defy the bearish sipping top and can push the quote to 23.6% of Fibonacci retracement around $1,572.
Given the buyers' ability to stay strong above $1,572, $1,587 holds the key to further rise targeting the monthly top surrounding $1,611.
Gold daily chart
Trend: Pullback expected