Silver Price Analysis: XAG/USD consolidates around $21.70s after testing $22.00
- Silver price remains steady at around $21.70s despite losing 0.39% on Tuesday.
- The confluence of the 200/100/50-day EMAs would be solid resistance to break.
- XAG/USD Price Analysis: In the short term, neutral biased.
XAG/USD stays firm after rallying more than 6% on Monday on investors’ flight to safety following the collapse of the Silicon Valley Bank and Signature Bank. Nevertheless, worries about a potential spread had waned. At the time of writing, the XAG/USD exchanges hands at $21.68 a troy ounce.
XAG/USD Price action
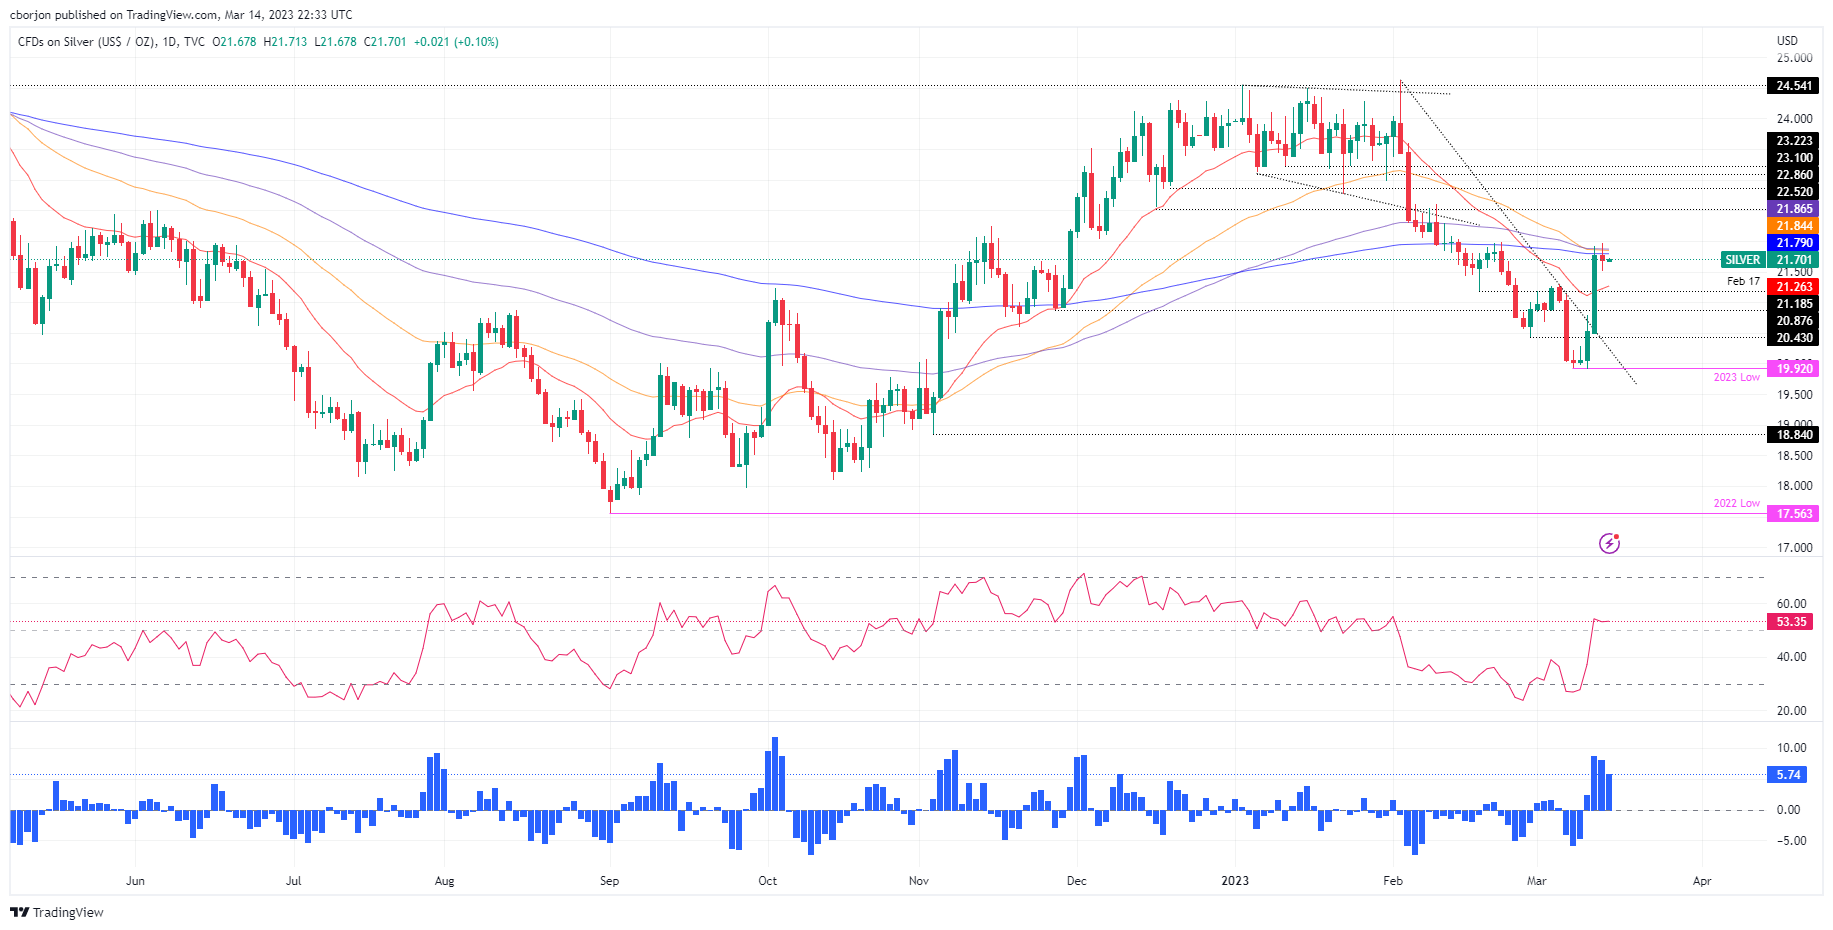
Silver prices retreated from weekly highs reached during the day at $21.96 due to several technical reasons. The 200, 50 and 100-day Exponential Moving Averages (EMAs) confluence around the $21.79-86 area capped the white metal climb. Therefore, the XAG/USD closed Tuesday’s session at around $21.68, below the 200-day EMA. That said, the XAG/USD is neutral to upward bias, though a daily close above the 200-day EMA must shift the bias neutral upwards.
On the upside, the XAG/USD first resistance would be the 200-day EMA at $21.79. Once cleared, the next supply zone would be the 50/100-day EMAs intersection, at $21.84-86, followed by the $22.00 figure.
On the flip side, the XAG/USD first support would be the 20-day EMA at $21.26. A breach of the latter will expose the March 10 daily high turned support at $20.78, followed by the March 13 low at $20.50
XAG/USD Daily chart

XAG/USD Technical levels
